Executive summary
We are pleased to share the impact assessment methodology that serves as a decision tool enabling TPG Rise Climate to build a portfolio of climate-positive companies. The methodology is designed to estimate the greenhouse gas emissions abatement potential of various companies across technologies, sectors, and maturities. It provides a framework to estimate both the magnitude of greenhouse gas emissions that will be averted by a particular company and a measure of the impact efficiency of investing in that company.
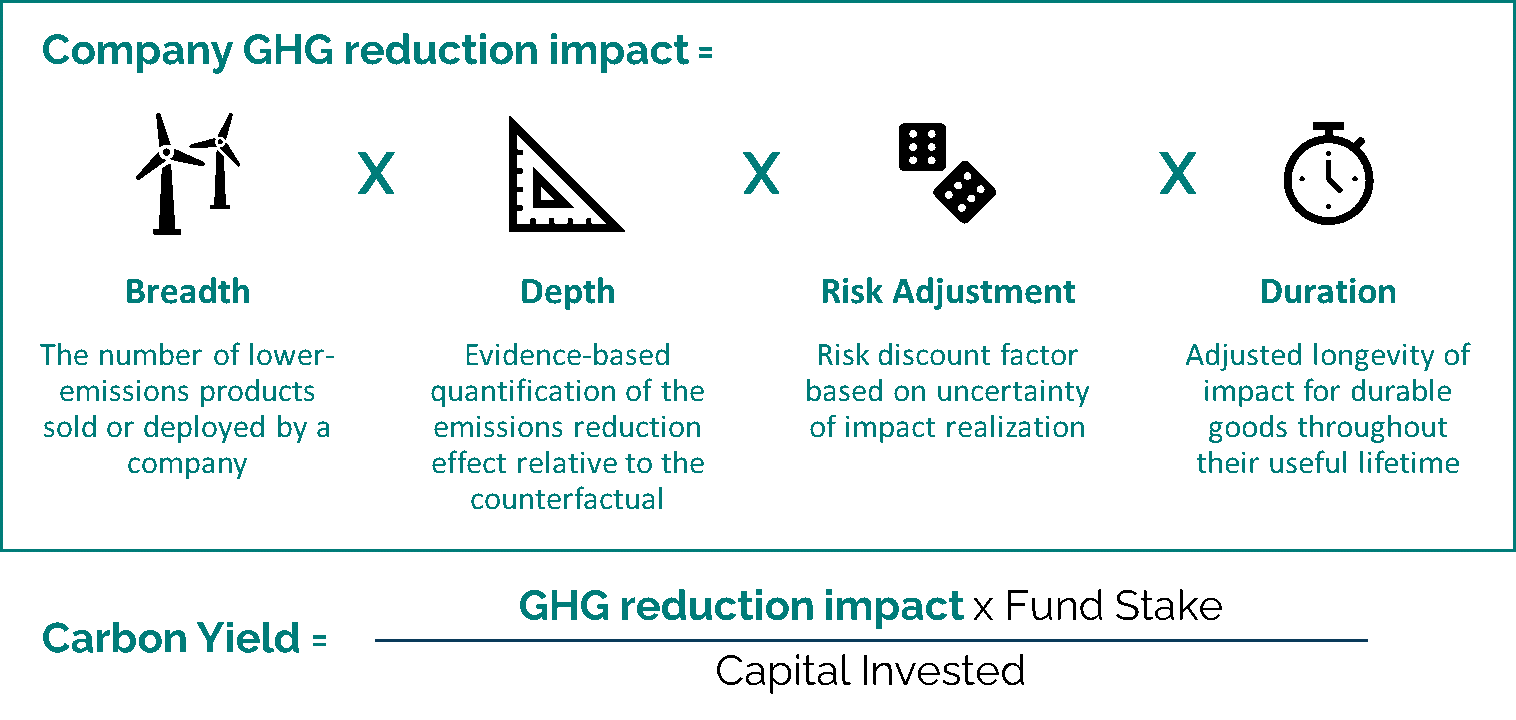
The Carbon Yield: The Carbon Yield metric, a measure of greenhouse gas emissions averted per dollar invested, is grounded in the principles of the Impact Multiple of Money to estimate the additional, differentiated, net emissions reduction attributable to a company.
Key methodological decisions: The methodology is based on substantial use of third-party evidence and research and rests on several key principles.
- Additionality: We adjust for the additionality a company provides, based on the markets it operates in, number of direct competitions, and role of regulation in its sector.
- Net impact: The methodology also focuses only on net company impact – meaning we will subtract out any emissions generated by a company’s operations above the counterfactual from the Carbon Yield calculation.
- Multiple time horizons: When non-CO2 greenhouse gases are emitted or averted by a company, we calculate a Carbon Yield using both GWP100 (100-year equivalent) and GWP20 (20-year) conversion factors, to account for the different Global Warming Potential and lifespans of various greenhouse gases in the atmosphere. We anchor decisions on GWP20 recognizing the criticality of the next few decades in avoiding planetary tipping points.
- Tailored energy usage emissions factors: When companies use or produce electricity, we apply context-specific energy emissions factors depending on the product or technology.
- Risk adjustments: All company outputs are risk-adjusted using a consistent set of risk discount rubrics, to account for differences in technological viability and the likelihood of impact realization from the company’s products.
- Longevity: Finally, when a company builds long-lasting, durable products with an expected useful lifetime, we attribute a portion of that lifetime impact back to the company. These decisions and approaches are explained in more detail in the section titled “Methodological points of relevance in Climate.”
Complementary assessments: We recognize that not all impacts can be quantified. We therefore conduct a qualitative scan of potential or uncertain positive and negative impact pathways to complement the analytical Carbon Yield approach. The team also evaluates company performance on various responsible investing factors. We screen companies using a proprietary, industry-specific framework based on leading global standards. These additional assessments provide context for interpreting the Carbon Yield metric in light of other risks and considerations, helping to provide a more holistic view for impact-minded investment professionals to make their decisions.
Grounded in evidence and continued learning: We aim to estimate impact utilizing research and with rigor so that investors can have greater confidence in the impact of the companies in which they invest. Our experience across the numerous companies we have assessed has taught us that context and the specifics of a company’s business substantially drive the magnitude of impact, and that evidence and research are key to understanding that impact. We continue to improve the approach as research and learnings dictate. We are happy to share this approach and learnings, and we welcome engagement with others on the methodology to continue to improve its usefulness as a decision tool.
Introduction
The purpose of our impact analysis is to provide an evidence-based estimate of the social and environmental return on invested capital for investments made by TPG Rise Climate and the Rise Funds. This analysis provides increased confidence to impact investors that the companies they invest in will have a positive impact. This decision tool has proven critical to attract large-scale institutional capital to invest in companies whose products or services create positive impact.
This white paper provides a summary of our approach to estimating impact. It then delves into specific topics related to impact in climate sector companies. For a reference to the underpinnings of our broader approach, and in particular the critical use of research and evidence in grounding assumptions, please see the companion white paper, Evidence-based Impact.
Importantly, this approach is a decision tool. It is designed to provide an informed estimate of impact such that investment decisions can be made with greater confidence that a company will have positive impact. Inherent in that statement are three key points:
- The approach generates estimates. Just like financial models, there are assumptions inherent in the approach, and we strive to undergird those assumptions with as much evidence and third-party research as possible. Because we are deeply aware of what it takes to make those assumptions, we do not claim accurate precision.
- The approach is fit to the premise of a fund and therefore makes choices about weightings (e.g., of lifetime value) in order to align decisions to meet that premise. This is a different purpose from accounting.
- The approach is executed to inform investment decisions, and therefore it must be implemented at the speed of a deal cycle. That requires efficiency.
We are keen to understand the magnitude of a company’s positive climate impact, which enables TPG Rise Climate to understand and compare the emissions reduction potential of companies and technologies across sectors. We do not claim complete accuracy and precision, but instead seek to project and anticipate emissions reductions under future scenarios. We adjust and discount our projects as appropriate, based on factors such as market and technology uncertainty and competition, to arrive at estimates that enable a reasonable degree of comparability.
Our experience across the 480+ companies we have assessed has taught us that context and the specifics of a company’s business substantially drive the magnitude of impact. These assessments have covered a wide range of sectors, technological maturities, and deal types, which has given us a sense of their nuances and complexities in assessing impact. Intuition or simple sectoral cuts are insufficient guides to impact. Evidence and research matter.
We continue to improve the approach as research and methodological advancements dictate. Since we operate at scale across many companies, we can identify patterns and challenges that lead to more refinement. We are happy to share this approach and our learnings, and we welcome engagement with others on the methodology to continue to improve its usefulness as a decision tool. In that light, this white paper is a living document that is updated periodically as refinements are made.
Summary of the impact assessment methodology
We start our impact assessment by identifying how a company’s products and services affect individual and environmental wellbeing. We then translate these activities and outcomes into impact pathways. Each pathway connects how a business activity materially benefits or harms people and the planet.
Each pathway is then defined by its breadth, depth, and an adjustment factor based on the uncertainty of impact. Pathway analysis begins with a company’s breadth—i.e., how much of the product is produced or how many people the service reaches. For example, a plant-based protein company’s breadth equals its kg of product sold, and a renewable energy company’s breadth equals MWh of electricity generated. We base our breadth calculations on projections from TPG investment professionals, which incorporate substantial industry and company insights as well as market and technology due diligence, and often apply meaningful discounts to management projections. This data from the investment team provides detailed insight into the segmentation of customers, allowing us to examine effect sizes for the specific groups affected by company activities and to assess impact in the context of local geography. For example, installing a windmill in China or India would offset more emissions-intensive power generation, given the volume of coal power plants in those countries, than installing a windmill in Sweden would. The use of deal team projections also enables consistency between the financial and impact assessments.
Next, we assess a company’s depth—i.e., the effect size per unit of output. In some circumstances, companies have commissioned their own rigorous randomized control trials (RCT) to determine the effect of their products. For example, CLEAResult, an energy efficiency services firm, has conducted RCTs to measure the effectiveness of its behavioral intervention programming. However, such studies are uncommon. In the absence of company RCTs, we draw on the best third-party evidence available. We start by conducting a literature review to identify the highest-quality research available on similar interventions in the relevant geographies. Our experience across sectors enables us to continuously improve and streamline this process. Given the unique scale of our work, we have built a database of deals and research called Y DataTM, which includes details on government and academic data, research reports and findings, and company-specific nuances for each deal. We continuously expand and update Y DataTM , enabling us to constantly learn and improve our methodology, while maintaining consistency with precedent deals. As of year-end 2021, we have reviewed 480+ deals and curated 3,600+ pieces of quality research.
In the context of climate sector companies, when considering the depth of impact from greenhouse gas (GHG) emissions, it is important to consider both estimated emissions averted due to a company’s products and services and the company’s own material emissions. To assess the net GHG emissions reductions that are enabled by a company, we estimate the emissions averted by the company’s products and services relative to the incumbent products and processes that are displaced. In other words, we compare the emissions intensity of a company’s product to the emissions intensity of the counterfactual, conventional product that it replaces. We also deduct the company’s own material emissions from the estimated emissions averted.
The counterfactual — i.e., what would likely have happened in the absence of the company — is a key component of assessing the net impact engendered by the company. As part of the counterfactual, we analyze whether a customer would have purchased a similarly effective substitute in the absence of the company. To estimate this likelihood, we consider a sector’s growth rate, total addressable market, market penetration, number of competitors, differentiation from competitors, and regulatory environment.1
The third component of depth is assessing the longevity of a company’s impact. For asset-heavy deals that enable a permanent step change in impact, we attribute the full lifetime impact to the year an asset is installed. For example, a wind farm with a 30-year useful life of turbines receives attribution for 30 years of GHG emissions averted in the year the turbines are installed.2 The inclusion of lifetime impact enables us to capture the importance of investing in companies that mitigate climate change over the long term.3
We then adjust each impact pathway based on the uncertainty of impact—i.e., the quality of research and how well it reflects the real-world activities of the company. The research risk itself breaks down into several components captured in our risk adjustment rubric, including rigor of evidence (i.e., RCT vs. observational study), geographical similarity, and number of linkages between company output and impact. The result is a risk adjustment factor for each pathway.
Finally, we calculate the portion of post-exit impact attributable to the capacity built during the hold period. We call this the capitalized value of impact. To arrive at this figure, we generally discount the impact generated in the last year of holding (less any impact capacity in the installed base) over the subsequent five years to assess post-exit impact attributable to the hold period. We adjust the discount factor in situations where the durability of the impact is likely to be higher.4
Once we have established depth, breadth, and the risk adjustment factor, we calculate a company’s Carbon Yield and Impact Multiple of Money. To calculate the Carbon Yield, we multiple these inputs together for the hold period to estimate the metric tons of net averted CO2e emissions, add the same for post-exit value, multiply by the stake held, and divide by dollars of equity deployed.This results in estimated metric tons of CO2e emissions averted per dollar of capital deployed. The Carbon Yield enables comparison of estimated impact efficiency across companies in terms of carbon aversion.
For deals whose impact include non-carbon aversion pathways, we translate impact into dollar equivalents through impact monetization, generating an Impact Multiple of Money. Examples of these latter pathways include efficient water use in water-scarce regions, natural resource preservation, and health improvements. We ground monetization figures in third-party research and evidence.5 The Impact Multiple of Money is calculated by the same method as the Carbon Yield: multiplying the company’s breadth, depth, and risk adjustment factor for each pathway, and summing the impact generated during the hold and post-hold periods to arrive at a total monetized value of impact for the company. We then multiply the total monetized impact by the stake taken in the company and divide by dollars of equity deployed. The resulting IMM metric enables comparability across sectors and activities.
An underlying theme of this methodology is collinearity between the financial returns and the impact enabled by a company’s products and services. For collinear companies, impact grows as product sales grow. In cases where collinearity does not hold, the company may still generate net positive impact, but the impact efficiency will typically be low. By comparison, a company whose impact increases proportionately with each additional unit of product sold will likely have a higher Carbon Yield and IMM.
Methodological points of relevance in Climate
Although our Carbon Yield calculation is grounded in the same principles and approach as the Impact Multiple of Money developed for the Rise Funds, there are several considerations that are more common in climate-sector deals that deserve additional discussion. These include:
- Increased regulatory mandates
- Variable levels of competitive intensity across subsectors and geographies
- More players in the value chain
- Considerations around net emissions
- Differentiated timelines and intensity of impacts across greenhouse gases
- Differentiated emissions factors depending on operational context
- Intensity of capital expenditures, leading to permanent step-changes in impact
The following section contains additional information on our methodology for incorporating these dynamics into our impact modeling. We will continue to adapt our approach as the climate tech sector, academic research, and impact management best practices evolve.
Steps for quantifying the additionality of a climate company
Our impact analysis centers around the additionality of a company. To quantify this additionality, we compare impact generated by the company against an estimate of what would have happened in its absence (i.e., the counterfactual). There are two components we typically consider when estimating additionality: (1) the “effect size” (or the depth of an outcome generated by the company), which can for example, be a 1,000 metric ton reduction in CO2e emissions relative to the counterfactual product, and (2) the level of competition in the market.
A randomized controlled trial (RCT) is the highest quality measurement of a company’s or intervention’s additionality, in terms of the effect size generated. For example, if we were assessing the impact of converting a farm from conventional to low tillage practices, RCT studies are available that have randomly assigned plots of land to conventional tillage and to low tillage. These studies have found that low tillage increases carbon soil sequestration and reduces erosion. However, such studies are not always feasible, both for reasons of practicality and ethics—specifically in the case of life saving interventions. When an RCT is not available, we rely on observational studies and meta-analyses to estimate how effective an intervention is likely to be.
In addition to these effect sizes, we also need to layer in the likelihood of competitors providing equally efficacious substitutes in the absence of the company. We use a rubric to estimate this competition factor (see figure 1 below). The rubric accounts for a sector’s growth rate, total addressable market, market penetration, number of competitors, and differentiation from competitors (e.g., pricing, quality, customer segmentation, etc.), and the role of government regulation (given the influence on degree of competition, see below). By discounting the effect size by the competition factor, we arrive at a proxy for the company’s additionality per unit of output (i.e., impact that would not have occurred in the absence of the company).
Figure 1. Competition Factor Rubric
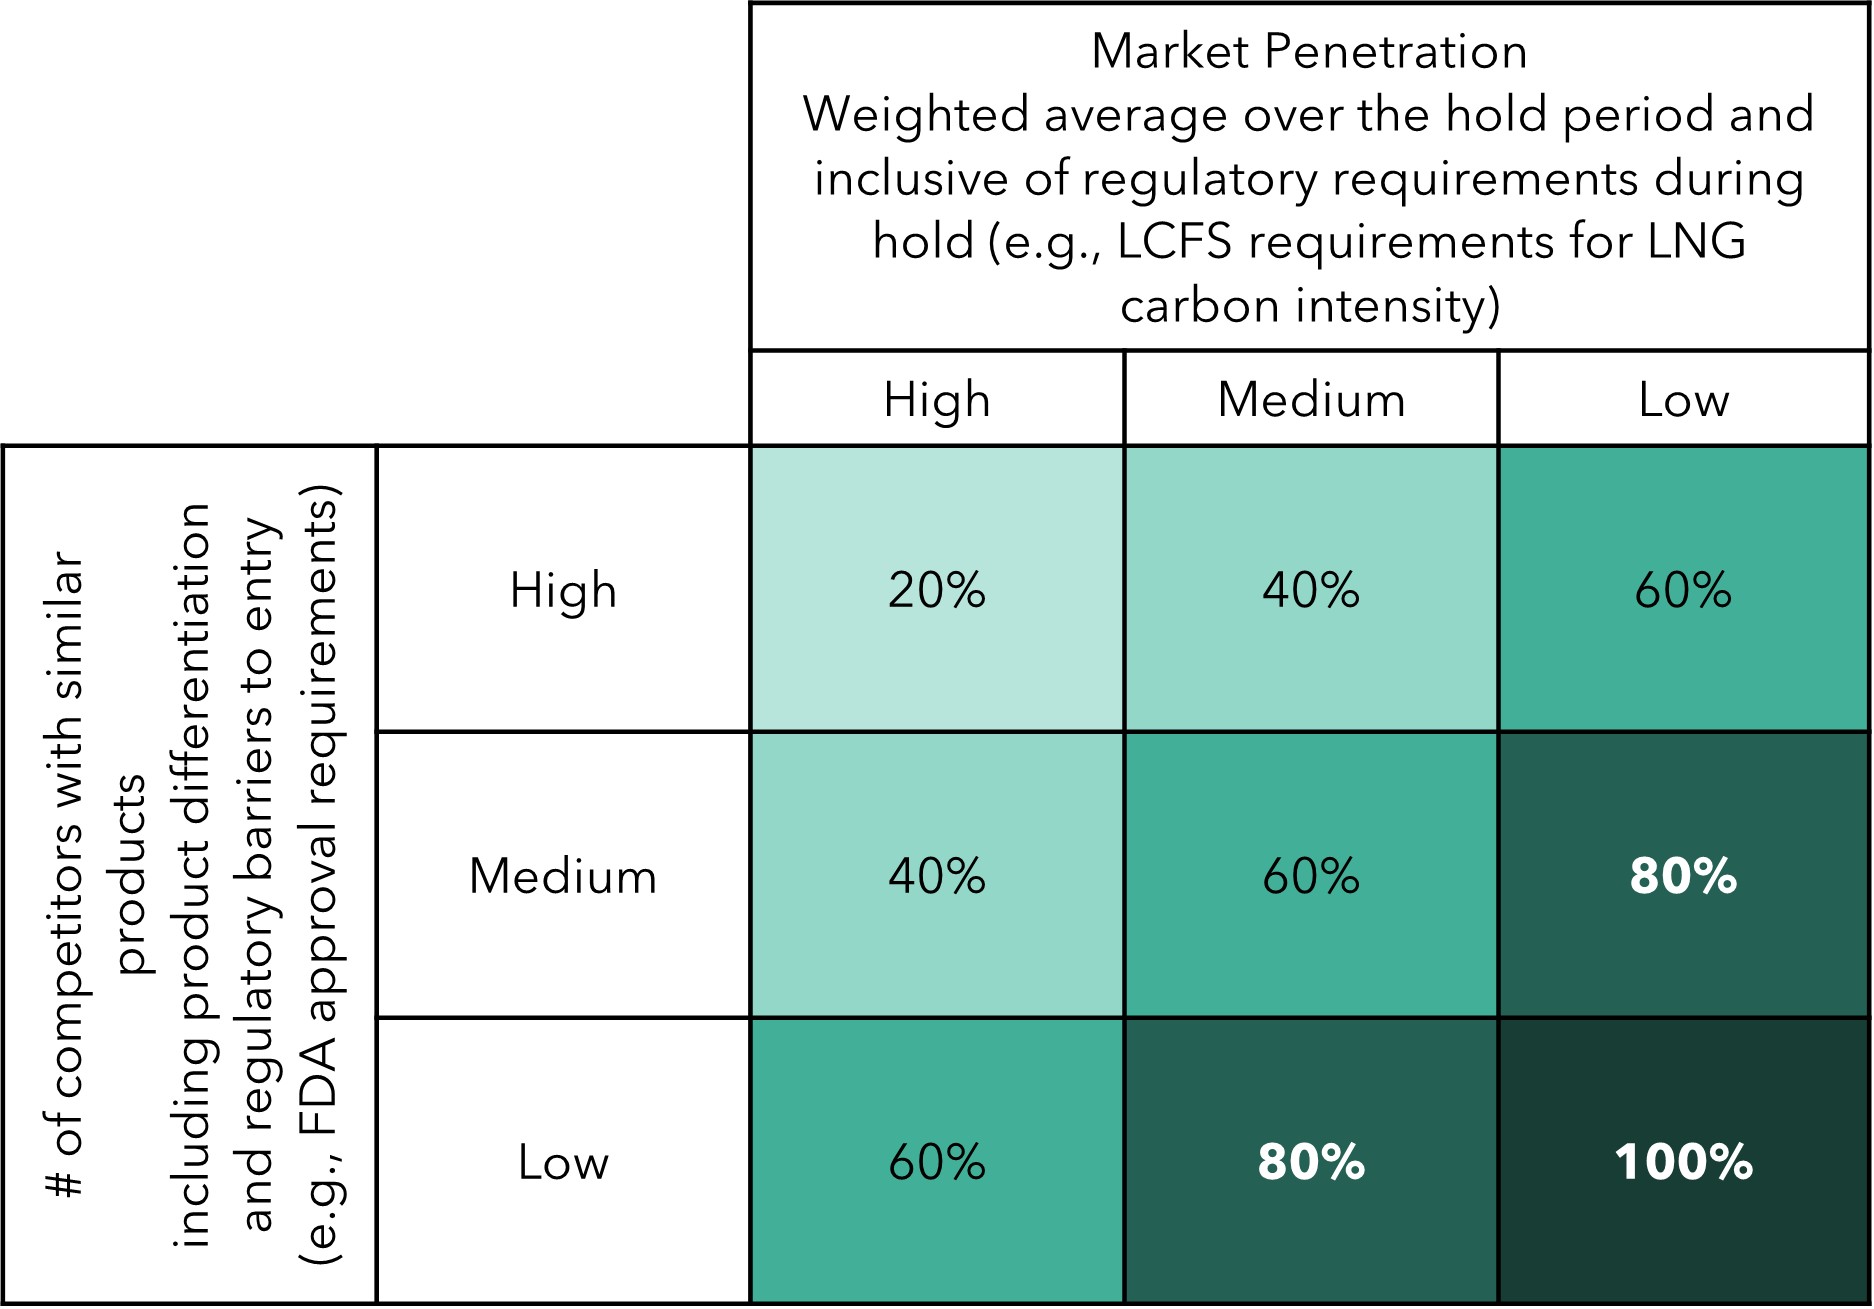
Note: The figures in the rubric display the percentage of impact attributable to a company operating in each section of the rubric. For example, the effect size of a product that is assessed as “medium-medium” would be discounted by 40% to account for competition, and 60% of the effect size would be attributed to the company.
Government regulation serves as an important input in calibrating competition factors for heavily regulated sectors such as climate. Government interventions in the form of incentives (such as subsidies) and deterrents (such as fines) play a large role in the likelihood of a competitor offering a substitutable product or service. A highly incentivized market, such as energy efficiency in Vermont, is more likely to have many competitors with limited differentiation and to have high market penetration. In such a market, much of a company’s products and services are likely to be substituted in its absence.
Additionally, we assess regulations for feasibility and timeliness. Although many countries have set targets for achieving environmental goals, such as 100% EV adoption, many of these targets will not be met by the target date. For example, India has set a target for all three-wheelers (e-3W) to be electric by 2023. However, industry reports estimate only ~50% e-3W adoption in India by 2024. This example demonstrates that the existence of regulation alone does not necessarily change a competition factor. It is the effect of regulation on the total addressable market, sector growth, and substitutable products and services that can shift the competition factor.
Lastly, we generally attribute full additionality (as calculated above) to a company that produces a sub-component of an impactful product, regardless of how many other companies are also involved in creating that product. Attempting to attribute the percent contribution of each actor to the overall product impact would introduce false precision to our assessment and could lead to attributing some portion of impact for components that are not crucial to the end product’s environmental benefit (e.g., the chassis of an EV). Rather than adding uncertainty to the calculation, we attribute full impact for any outcomes that would not have occurred in a company’s absence. We also apply the tools within the IMM to ensure deals across a given value chain are properly discounted for impact risk and additionality, in four ways:
- Firstly, a company only receives credit for the components that are sold for use in climate technologies (e.g., if a company sells inverters both for solar panels and air conditioners, only those sold to solar panels would receive impact credit).
- Secondly, a company selling a highly commoditized component, like electrical wires used in EVs, will see its impact score significantly discounted through use of the competition factor, while one selling a highly specialized and differentiated component requiring significant R&D expenditure will not.
- Thirdly, if the component has non-impactful use cases and we believe there is a risk that the company will expand into that area, we will apply a substantial “usage” risk discount.
- Fourthly, if the component has a usable life that is lower than the usable life of the end product (e.g., eVTOL battery), the manufacturer of that component will only receive impact for the usable life of the component (not for the full usable life of the product)
This value chain approach tends to result in three categories of impact attribution:
- Full impact for vital components: For example, if a company makes an individual but vital component of an EV battery (such as an anode or cathode), we attribute full impact to the company for the total capacity of EV batteries produced – even though there are other manufacturers involved in the value chain – because if the anode or cathode were removed, the product would cease to function as a battery. Therefore, all value chain actors that are vital to the impact delivery of a product receive full impact credit.
- Incremental impact for differentiated components: When a company manufactures a non-vital component that nonetheless enables an increase in output or impact potential, they receive credit only for the incremental improvement their component provides relative to the industry standard. For example, a company that made dual-axis solar trackers (which increase panel energy yield) would receive impact credit for the increased power that their product provides relative to fixed-tilt solar panels.
- No impact for commoditized components: In cases when a company manufactures a minor and non-differentiated component of an impactful product, such as the nuts and bolts for a wind turbine, or the chassis of an EV, they would receive no impact credit – because these components are 1) not vital to the impact delivery lever of the product (electrification of energy and transport systems), and 2) not substantially different from the industry standard.
Following this approach enables us to give full impact credit for technologies and solutions that truly enable a step-change in impact potential within a certain value chain, while preventing undue impact attribution to the minor and commoditized components that would have been provided by another supplier in the absence of the target company. This approach also aligns with our treatment of value chain impact additionality under the core Rise methodology – where, for example, a medical device manufacturer would receive impact credit for the additional lives saved with their technology, but an adhesive bandage manufacturer would not receive any impact for producing a non-differentiated, commoditized product. When aggregating impact at the portfolio level for reporting, we ensure any overlapping impact is only counted once. For example, if a renewables developer built a solar farm and then sold it to a utility, and Rise Climate had a stake in both companies, the greenhouse gas emissions abated by the solar farm would only be counted once in Rise’s annual impact report. When Rise Climate invests in two companies that operate within a single step of the value chain (e.g., a producer of solar inverters and a producer of solar cells who both sell their components for use in the same solar development), we would similarly ensure the impact provided by those solar panels was not double-counted.
Capturing company greenhouse gas emissions in the impact analysis
For climate deals, we consider all categories of emissions that are relevant to the comparison of the target company’s product against the counterfactual product that it displaces. In other words, we include all emissions categories that are material to determining the differentiated net impact of the company. For example, an impact analysis of a company that makes the electric vehicle (EV) battery manufacturing process more efficient would only compare the manufacturing (Scope 1 and 2) emissions intensity, in gCO2 / kWh of EV battery capacity, of the new process against the incumbent process. It would not include the Scope 3 emissions from actually using the battery in an EV, because these emissions would be the same regardless of whether the new or old manufacturing process was used to create the battery. Therefore, many emissions impact estimates for companies that make and sell a specific product only consider the “cradle-to-gate” process (Scope 1) and energy use (Scope 2) emissions associated with manufacturing that product, because the use phase (Scope 3) emissions are the same between the company’s product and the counterfactual product it displaces. However, in the case of a compostable plastics company, we would also include the Scope 3 emissions from usage and disposal, because the disposal method is different between compostable and conventional plastics, and therefore the two products have a different lifecycle carbon footprint. In conclusion, we include any and all emissions categories (Scope 1, 2, or 3) that are material to the difference between a company’s product and the replaced counterfactual product, and this determination is made on a deal-by-deal basis.
Additionally, we do not calculate emissions for capital goods or infrastructure if they are consistent between the company and its counterfactual competitors. For example, if a bio-based plastics company constructs a factory to produce their plastic, we do not count the emissions from the cement, steel, and machinery needed to construct the factory, because we assume that in the target company’s absence, another factory that produces conventional plastic would have been built by a competitor. Therefore, we only compare the net lifecycle greenhouse gas emissions intensity difference between the bio-based and conventional plastics themselves, not the emissions from building the factory that produces these goods. Another example would be materials and construction emissions from building a wind farm. Wind energy companies emit ~15 g CO2e per kWh across Scope 1, 2, and 3 emissions, whereas they offset more than 450 g CO2e per kWh of U.S. grid emissions (NREL, 2014). Including the emissions from company overhead and wind farm construction would reduce overall impact by less than 5% and would not materially shift the impact analysis. In addition, the fossil fuel-fired power plants that the wind farm replaces would also require steel, concrete, and other materials to build.
We do include emissions from capital goods construction in cases where the company is substantially expanding the demand for a product – in other words, cases where a counterfactual factory would not have been built by a competitor. Instances where we are likely to incorporate the emissions from construction and materials into the carbon footprint analysis include new and expanding sectors, such as last mile transportation or milk production in sub-Saharan Africa. In these cases, increased access to goods and services likely generates “new” consumption and associated emissions and would be included in the impact underwriting.
The methodology above summarizes the pre-investment impact due diligence process. After investment, our Responsible Investing team engages with the company to complete a more fulsome carbon footprint analysis—including Scope 1 and 2 emissions—and then helps identify areas of opportunity to reduce emissions.
CO2-equivalents (CO2e) and GWP20 conversion methodology
We display a company’s net emissions using both 20-year and 100-year global warming potentials (GWP20 and GWP100) for converting from other greenhouse gasses (GHGs) to CO2-equivalent (CO2e) terms. We rely on IPCC estimates for these conversion factors.
When using GWP100—i.e., the global warming potential of a GHG over a 100-year period—one metric ton of methane has the same global warming potential as 34 metric tons of CO2, whereas over a 20-year period (GWP20), one metric ton of methane has the same global warming potential as 86 metric tons of CO2. The difference in GWP conversion factor is due to the short-lived nature of methane in the atmosphere. Methane persists in the atmosphere for roughly a decade, compared to over a century for CO2. During its short-lived atmospheric life, methane traps substantially more heat than CO2, which increases the risk of passing climate tipping points. Tipping points are critical thresholds that, when exceeded, can lead to a significant system change that could be irreversible. Examples include the loss of coral reefs, the melting of the Greenland ice sheet, and Amazon rainforest dieback. Passing such tipping points is a significant contributor to catastrophic climate scenarios. The use of the GWP20 metric highlights deals that materially reduce near-term warming, helping mitigate the risk of passing these tipping points.
For decision purposes in TPG Rise Climate and The Rise Funds, we anchor on GWP20 because averting emissions in the short-term can help avoid catastrophic tipping points. Unlike in policy contexts, a fund does not have to pick a single option for emissions aversion. The fund can invest in any deal that meets its financial and impact criteria whether averting methane, CO2, a short-term GHG, or a long-term GHG. Therefore, for the purpose of determining whether a company meets the impact criteria, we utilize GPW20 to reflect the value of financing near-term reductions that can help avoid tipping points. Per IPCC and research community best practice, we display carbon yield in both GWP20 and GWP100 terms for all companies that avert or cause a significant amount of non-CO2 greenhouse gas emissions. Displaying GWP20 and GWP100 CO2e allows insight into a company’s emissions (or averted emissions) on both a short-term and long-term timescale.
Calculating energy usage emissions and emissions reductions
Electricity use generally causes indirect (Scope 2) greenhouse gas emissions whenever it is generated through burning fossil fuels. We calculate the greenhouse gas emissions impact of energy usage in two ways, depending on whether the target company reduces or increases fossil-fuel powered energy consumption. Building new renewable energy capacity, or permanently reducing energy use intensity (EUI) through energy efficiency measures results in a reduction in marginal grid emissions. In contrast, when a company increases energy demand by building a new factory or developing an EV that will be charged over the next 15 years, the company causes an increase in average grid emissions.
The difference in treatment is aligned with how environmental lifecycle assessment (LCA) practitioners determine the impacts of manufacturing or consuming various products. An attributional LCA attempts to estimate the share of environmental impacts that should be attributed to a product, while a consequential LCA attempts to estimate how global environmental burdens will shift as a result of producing or using a product (Ekvall 2019). For example, the ILCD Handbook indicates that attributional LCA is generally applied when developing the carbon footprint for a specific product, comparing specific goods and services, or developing environmental product declarations, while consequential LCA is applied for change analysis, forecasting the environmental impact of implementing certain technologies, and policymaking activities. Our approach is aligned with this guidance because we attribute energy-related emissions to Rise-funded products that consume energy and determine the consequences of installing more renewable energy onto the electricity grid using marginal emissions factors.
The nuances of marginal versus average emissions are detailed below.
-
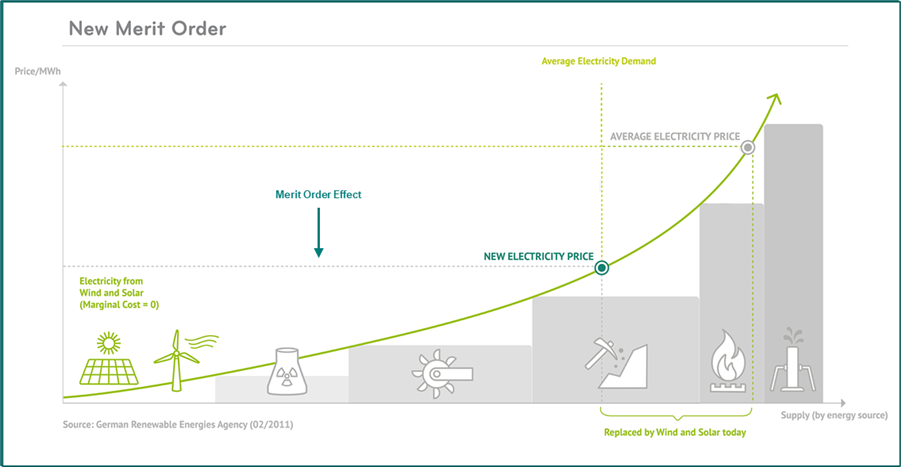
Marginal grid emissions factors: Companies that add new zero-emissions power generation to the grid will change the CO2 emissions factor associated with generating one unit of electricity: the kg CO2 emitted per additional kWh generated. Producing one additional unit of zero-emissions electricity changes energy usage emissions at the margin. Electricity grid operators call on the cheapest available sources of electricity to meet demand, with each additional unit of energy consumed increasing the marginal cost so that power is supplied at the market-clearing price. Because solar and wind plants produce electricity at almost zero marginal cost, they are typically called on first. Adding more of these renewables to the grid shifts the “merit curve”, shown below, to the right, meaning the most expensive generation method is no longer needed. Therefore, adding solar and wind generation to the grid offsets the emissions of the most expensive marginal unit of power generation displaced, rather than offsetting the average emissions of the grid. Similarly, a policy or technology intervention that improves energy efficiency will offset grid emissions at the margin, as it shifts overall energy demand down, meaning grid operators no longer need to call on the marginally most expensive unit of power generation.
-
Figure 2. Electricity grid generation merit curve
-
We use the UNFCCC IFI Dataset of Default Grid Marginal Emissions Factors to calculate the marginal emissions reduced by adding new renewable power to the grid or improving energy efficiency.6 The IFI provides two separate Combined Margin emissions factors, one for firm energy (hydro, geothermal, energy efficiency, etc.) and one for intermittent energy (solar, wind, tidal, etc.), which we apply respectively depending on the situation. These combined emissions factors are calculated by the IFI using the Operating Margin (OM) and Build Margin (BM) for each country. The OM represents the cohort of existing, current-state power plants whose operation would be affected by a change in electricity supply or demand. The BM represents the cohort of prospective, future power plants whose construction and operation could be affected by the change in supply or demand, based on an assessment of planned and expected new generation capacity in each country from 2019 to 2026. The IFI weights the Operating Margin higher than the Build Margin for intermittent energy, and vice versa for firm energy. This is because they consider new intermittent renewable energy to mostly displace current generation assets, while improvements to energy efficiency affect the long-term cohort of power plants that will be required to meet future energy demand.
-
Average emissions factors: We use average emissions factors to estimate impacts of absolute, permanent increases in emissions over time from additional energy demand. Marginal emissions factors are not as relevant for this type of impact analysis because demand will increase throughout the day, and not only during times of peak demand when marginal resources come online. In the long-term, grid operators will adjust to account for permanent demand changes, and many sources of demand are removed and added to the grid each year, making it inaccurate to assume a new product or plant will operate at the margin for its entire usable life. Companies and consumers can be economically incentivized (through real time or peak pricing schemes) to use electricity at times of day with lower marginal emissions. Therefore, we believe applying average emissions factors to electricity demand increases more accurately reflects climate impacts.
-
Annualized average emissions factors are calculated and reported by national agencies such as the EPA’s eGrid system. We use regional average emissions factors whenever available, and otherwise leverage reliable national average emissions factor data (for example, from the IEA or EEA) for our estimates. The national average emissions factor reflects the total generating capacity of all plants on a given electric grid, and how often they are called upon to generate electricity over the course of a year. Each unit of power generation on a grid has a different emissions factor depending on the fuel type, efficiency of the technology, age of the plant, transmission infrastructure on the grid, and many other factors.
Depending on the company business model and availability of research and data, we strive to model changes to future marginal or average emissions factors in the most realistic way possible. For example, we project decreasing future emissions factors in most countries based on expected grid decarbonization (leveraging both public commitments and academic scenarios for limiting temperature rise), and we may include hourly or intra-day differences in the marginal emissions factor, or use specific regional grid emissions factors, such as those presented in the EPA's AVERT system. Projecting future improvements in the greenhouse gas emissions intensity of power generation aligns with our approach to attributing “lifetime” impact to certain long-lasting investments, as detailed below. Based on future projected energy scenarios from IRENA and the IEA, historical trends, and/or academic research on electrical grids, we model which energy generation types are likely to be the most expensive asset (and thus the first to be replaced) on the grid in future years. Therefore, a combined solar and battery storage array that generates energy for the next 25 years may displace a coal power plant now, but a natural gas power plant 15 years from now. We account for these changing grid conditions in estimating the metric tons of CO2 averted by operating the solar plus storage plant in each year throughout its lifetime.
Attributing in-year and lifetime impact
Our analysis captures the material impact—both positive and negative—that a company enables and that would likely not have occurred in its absence. We credit this impact as either in-year or lifetime impact. Whether lifetime or in-year attribution is applied is dependent on the specific intervention(s) undertaken by the company, and both lifetime and in-year methodology may be used within a single deal. Lifetime impact is attributed when the following criteria are met:
- A company action leads to a permanent step change in impact potential,
- The benefits stemming from the intervention take place across multiple years, and
- A material level of upfront investment in the intervention is required
This is a key example of the difference between an investment decision tool (this approach) and accounting. Our premise is to align capital to scale impactful solutions, and therefore the assessment gives more weight to actions for which the impact, and the scalability of that impact, is more certain.
Long-term impact attribution stems from a binary company action—e.g., either a wind turbine is or is not installed—where we have greater confidence of the likelihood of achieving impact over multiple years. We most commonly use the lifetime impact methodology for companies with substantial infrastructure characteristics. For example, wind farm operators create a semi-permanent step change in energy production and emission reductions when new turbines are installed on the grid.
In-year impact is more common among consumer-packaged goods (CPG) companies. For example, plant-based protein companies generate impact by substituting for meat consumption, which reduces GHG emissions. Because each plant-based purchase is a one-time emissions reduction, the company only receives in-year impact for the total amount of meat consumption replaced that year. Put another way, the sale of plant-based protein does not create a permanent step change in impact and requires significant operational expenditure to continue generating impact in future years, and therefore receives only in-year impact.
There are three different approaches we take to monetize lifetime impact, depending on the product system in question:
- Permanent installations and durable goods: for enduring infrastructure such as wind farms, we attribute full lifetime impact in the year of construction
- Products with future capacity degradation: for products with a multi-year lifespan that degrade by a certain amount each year, such as solar panels and grid-scale batteries, we attribute lifetime impact less the amount of capacity that degrades throughout the useful life, in the year of construction
- Factories built with Rise investment that produce non-durable goods: for Rise investments that explicitly fund construction of a factory which will produce impactful, non-durable goods in future years, we discount factory production post-hold and attribute lifetime impact less that discounted amount in the year of factory construction
The following section provides more details on each type of lifetime impact attribution:
(1) Permanent installations and durable goods:
We can have high confidence in the future operation of certain types of infrastructure. For example, wind farms have very low ongoing costs to operate once constructed and will continue to generate electricity at very low marginal cost throughout their lifetime. Capital expenditure on the turbines comprises 95%+ of the expenditure necessary to produce wind energy over the turbines’ life, whereas operations and maintenance contribute less than 5% of lifetime expenses. Since the ability of the project to deliver impact is highly dependent on the initial capital expenditure, we attribute 100% of the impact across the turbines’ 30-year useful life to the year of installation. Another example would be a more efficient electric motor installed in an HVAC system – manufacturing and installation represents nearly all lifetime costs, and once installed, we have high confidence that the motor will continue to operate throughout its useful life.
(2) Products with future capacity degradation:
The efficiency or capacity of some technologies degrades over time. For example, the amount of energy that lithium-ion batteries can store and discharge each cycle gradually degrades each year. The amount of energy that can be captured by solar panels similarly degrades over time, as does the average number of kilometers driven per year in an EV or an ICE car. We take the degradation rate into account when calculating lifetime impact for all technologies with a well-established and material rate of degradation. This approach also extends to modeling the “future world” in which companies generate lifetime impact whenever this approach is feasible and supported by evidence. For example, we give lifetime impact credit to a wind or solar farm for averting greenhouse gas emissions from fossil-fuel fired power generation. However, the marginal emissions factor for an electrical grid will change over the course of the wind or solar farm’s 20–30-year lifetime, as fossil generation assets are retired, and more renewables come online. We account for this future improvement in electricity grids by either citing academic research on projected future grid conditions (where available) or projecting out the rate at which the emissions factor has changed over the last 10 years linearly into the future.
(3) Factories built with Rise investment that produce non-durable goods
Even if a company is producing non-durable goods, investment to scale the physical capacity to produce those goods leads to a concrete step change in impact potential. In these instances, a company has both significant capital expenditure—enabling lifetime impact—and significant ongoing operational expenses. For these cases, we split in-year and lifetime impact based on the proportion of capex required relative to the proportion of opex required for manufacturing overhead and asset maintenance over the life of the asset. For example, take a bio-based plastics company that is installing a new factory with a useful life of 20 years. Over that period 80% of expenses will come from operations—including manufacturing overhead and maintenance—and 20% of expenses will come from the upfront capital expenditure to build the factory. We therefore attribute 20% of the factory’s lifetime production capacity as impact in the year the factory is constructed, and 80% of the in-year production capacity as impact in each year of the Rise Climate investment holding period. Splitting impact into lifetime impact attributable to capex, and in-year impact attributable to opex enables us to avoid double-counting the impact of building and operating a factory. In addition to the capex-opex split, we also apply a discount to the long-term impact of factories built during the hold period to account for the risk that a factory will close or decline prior to the end of its useful life due to technology innovation, regulation, the end of a patent resulting in increased competition, etc. The discount is applied linearly at a 5% rate each year beginning in the first year after the hold period ends.
We always attribute impact at the product level where possible, and only attribute impact for factory production when the factory is producing non-durable or single-use items. We do not “stack” or “double-count” lifetime impact: for example, if a TPG Rise Climate investment funded the construction of a factory that produced batteries, each of which had a 15-year lifetime, we would calculate only the product-level lifetime impact of the batteries made in the factory during hold, and not the lifetime impact of the factory that produces the 15-year lifetime batteries. This is because we have higher confidence in the degradation rate of batteries than the continued operation of a factory in the future. We therefore assign lifetime impact for each deal using only one of the three methods outlined above, and we always prioritize the method that best represents the company or product impact.
Finally, our lifetime impact methodology accounts for the different level of impact inherent in building a long-lasting technology versus merely operating that technology. For example, if a renewable power company both built new solar and wind farms, and acquired existing solar and wind farms, they would receive lifetime impact credit for the new-build renewables, and only in-year impact credit for purchased renewables. This approach recognizes the risk and capital expenditure taken on by the company to permanently increase renewable capacity by assigning lifetime impact to newly built renewables. Although the company could sell those renewable assets to another owner/operator in the future, they have permanently improved the capacity for zero-emissions power generation. Without their investment or expertise, the renewable asset would not have been built, and could not be owned or operated by anyone. Therefore, the builder of the renewable asset receives lifetime impact credit as long as the asset is operational, even if they sell it to another operator in the future.
As shown in these examples, the attribution of in-year and lifetime impact varies by sector. Asset-heavy sectors typically receive lifetime attribution due to the permanent step change in impact enabled and the significant upfront capital required. The Carbon Yield metric conveys which investment opportunities efficiently deploy invested capital to mitigate climate change. The inclusion of lifetime impact captures the importance of investing in companies enabling climate change mitigation over many years. Because these projects are often asset-heavy, they require more upfront capital, but over the long-term they are efficient at deploying that capital toward combatting climate change. The inclusion of lifetime impact captures this long-term impact generation ability.
Additional considerations in the impact calculation
Adjusting outcomes for impact realization risk
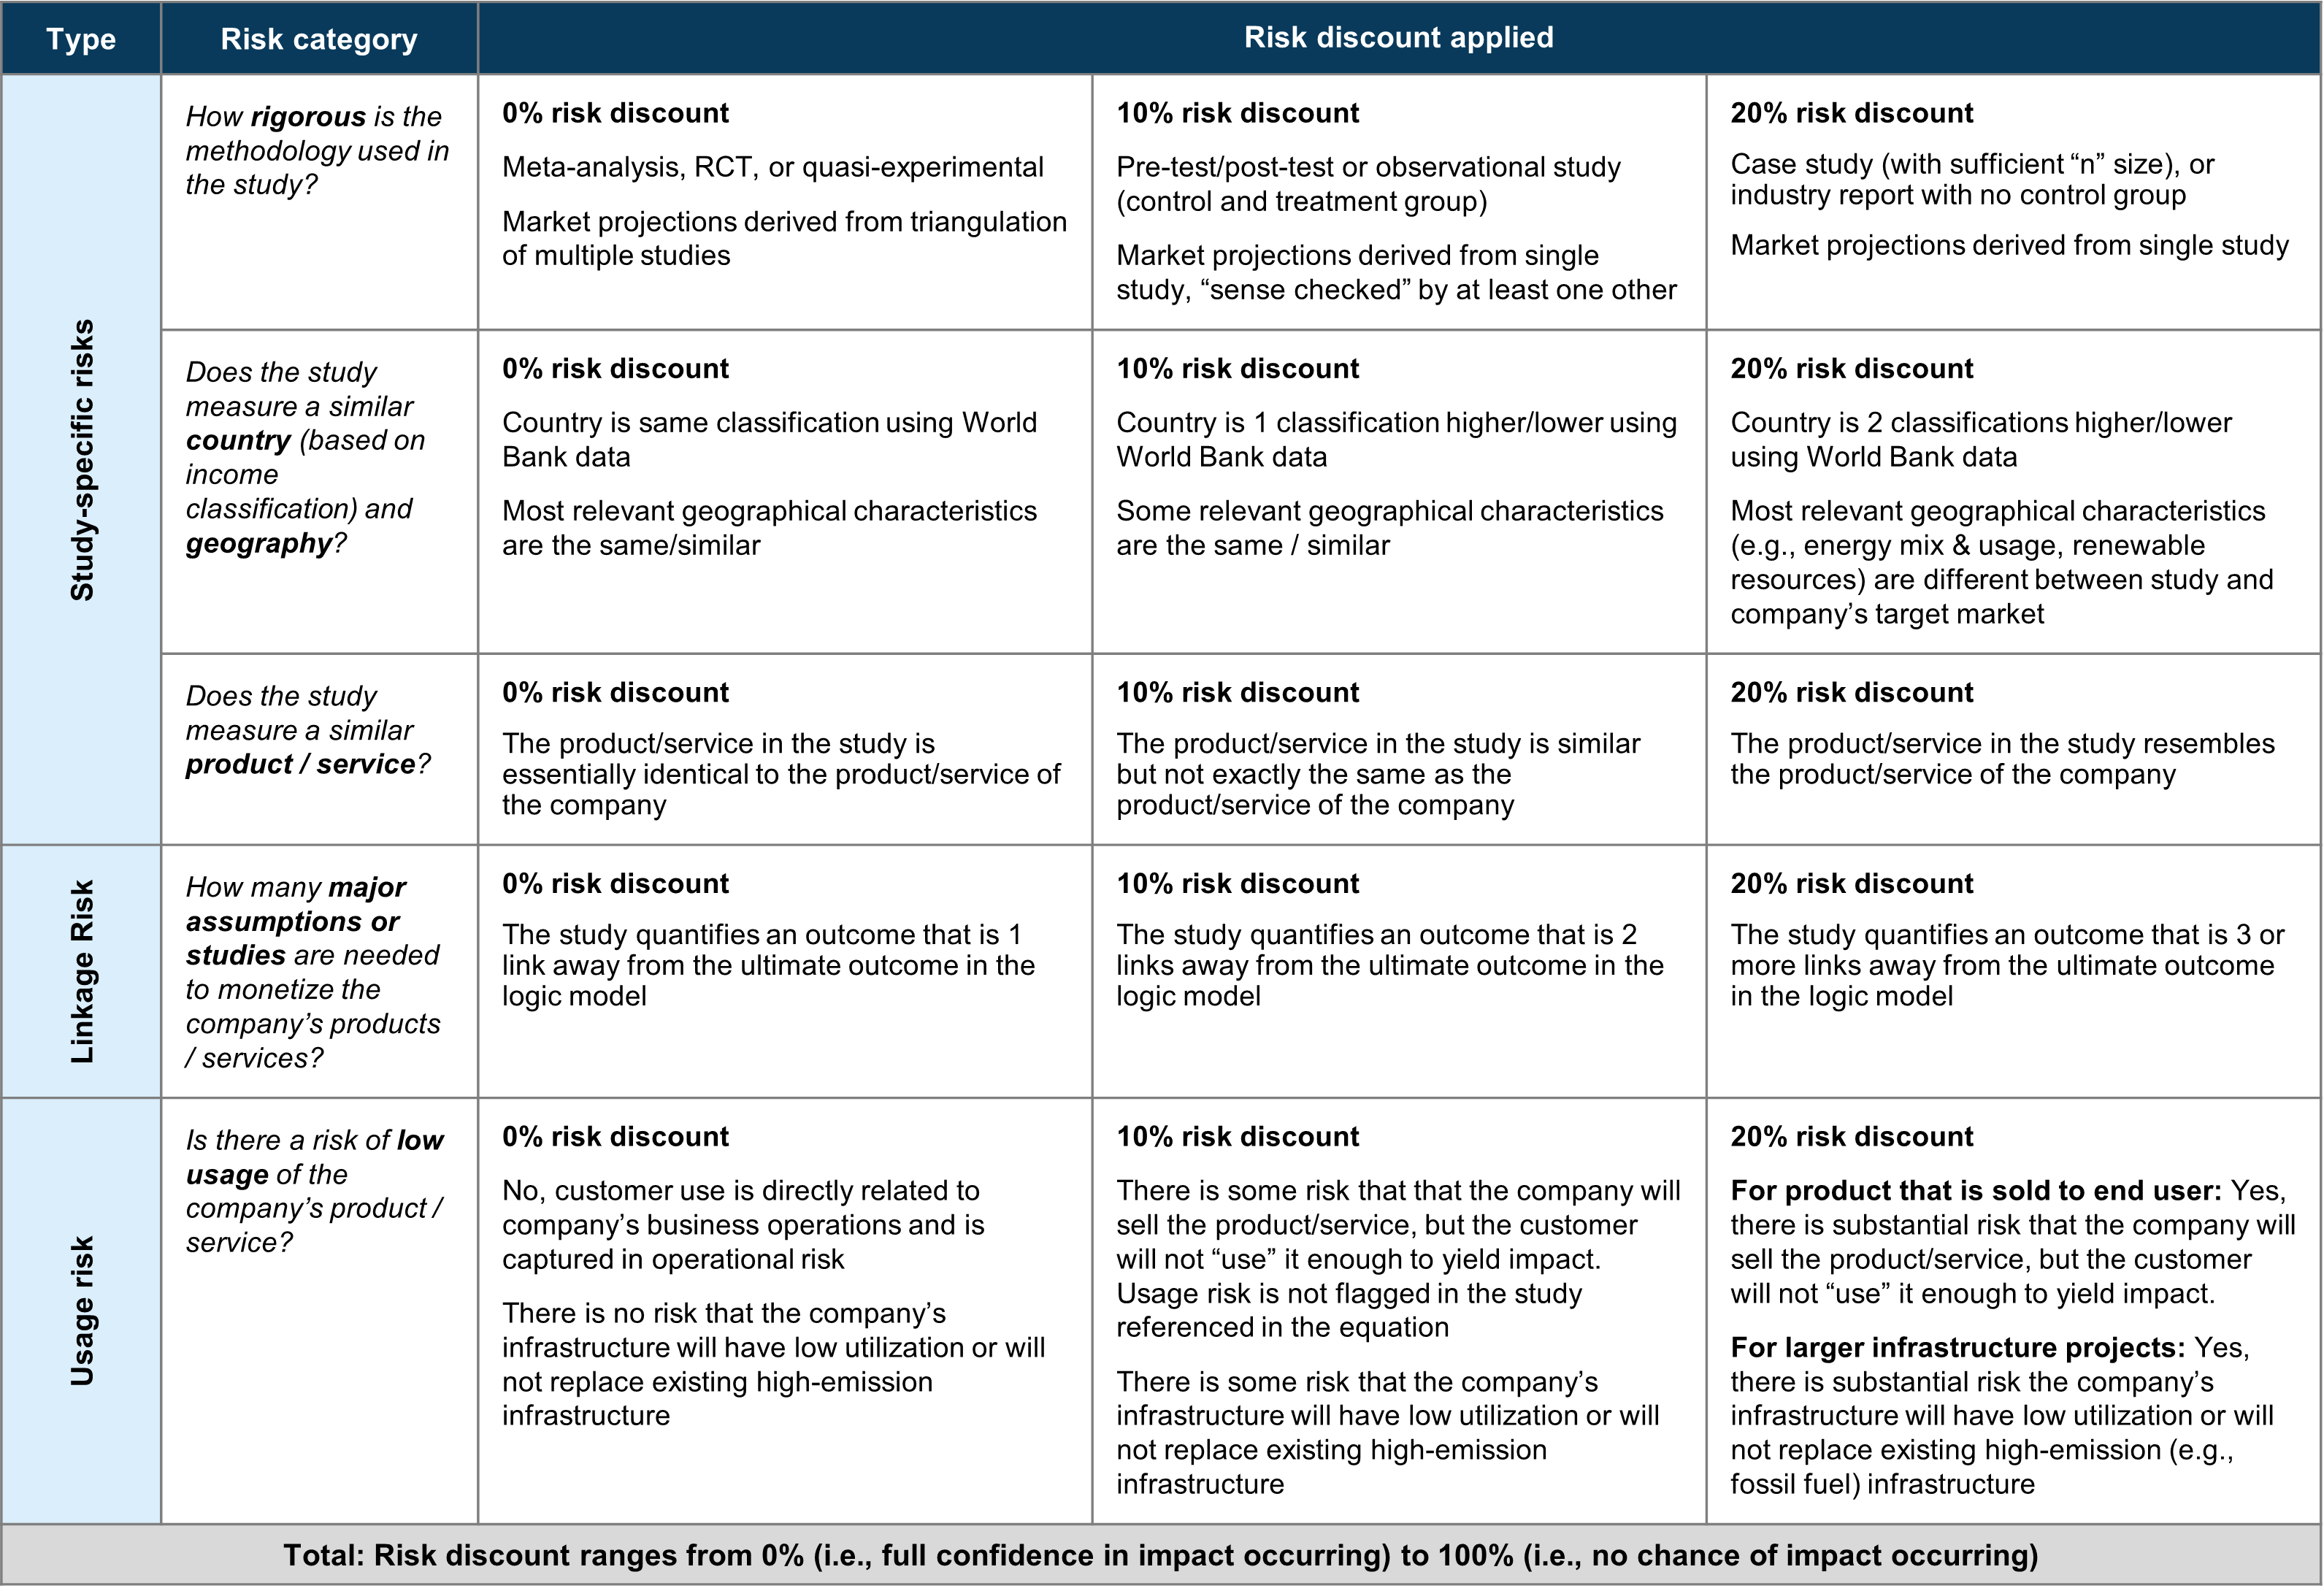
For all deals, we account for the likelihood of impact realization by discounting each pathway based on various risks to achieving impact. The sources of these risks can be grouped into three categories:
1) Study-specific risks are risks associated with the degree of alignment between academic research and evidence and its application to an investment’s outputs and outcomes. If the available studies are based on older data, or data from a different product or geographic context, we capture this with a higher study-specific risk in the rubric.
2) Linkage risks are meant to capture the number of links in terms of assumptions or academic research studies needed to bridge the input-to-outcome logic chain for a company’s products or services. If a model requires several assumptions, or the collation of many studies, the degree of confidence that the investment is “directly linked” to the monetized outcome goes down.
3) Usage risks are impact risks associated with low adoption or utilization of the company’s products/services. If there is a high risk of usage being low or significantly different than assumed, even those outputs with the highest monetized impact are rendered less impactful.
We have refined the risk rubric that we have used historically with the Rise Funds to better reflect key sources of risk in this space for TPG Rise Climate deals. Climate deals often involve earlier-stage technologies, putting more emphasis on the need for evidence specific to those technologies and certainty as to how the technology will be used once it is scaled. When assessing the rigor of an academic study used to assess a Climate deal’s impact, we believe closeness of researched technology to the company's technology is just as important as the methodology used for the study (e.g., RCT vs case study), so we redistributed the weighting points for these two risk categories, weighting them equally. Similarly, while we still apply a discount based on the "linkage risk", or number of major assumptions taken between academic research and our monetization model, the most important assumption often involves the future use of the technology, captured by "usage risk"; thus, the scores for these two categories have also been redistributed so they are weighted equally.
Along with the redistributed weighting, we also adapted the guidance under each category to reflect its application to climate companies. For instance, evaluating climate deals often requires rigor in the form of a mix of academic research and accurate data (e.g., marginal emissions factors of energy mix by country), versus traditional deals in the Rise Funds that rely primarily on academic research. For this nuance we have added language to help evaluate the accuracy of key data points and LCAs when assessing rigor of research. Finally, climate deals often involve products or technologies that will “green” infrastructure (versus a product used by an end customer or business). To better assess infrastructure impact risk, we have switched from assessing whether research focuses on the applicable “population group” to assessing whether it focuses on the applicable geography (e.g., energy mix, renewable resource availability) within the country of interest, and we have added language to help evaluate the certainty around how infrastructure will be utilized.
The outcome is a climate-specific risk rubric with five equally weighted risk categories, shown in Figure 3. This rubric is intended to be applied not only to TPG Rise Climate deals, but also to deals in the Rise Fund that are similar to typical climate deals (i.e., energy sector or infrastructure deals).
Figure 3. TPG Rise Climate Impact Risk Rubric
How we attribute the capitalized value of impact post-exit
The impact approach should consider the longevity of impact each company creates, while at the same time trying to mitigate “double counting” of impact that might be enabled by the next investor. We have taken the following approach to walk the line between these two considerations. Impact is underwritten based on both impact generated by the company during the fund’s hold period, plus an additional amount for the capitalized value of impact post-exit.
To calculate post-exit value following ownership, we take one of three approaches. For non-capex heavy deals, where impact is solely measured by in-year impact, we take the output in the final year of holding, subtract out the output from the last year before the Rise Climate investment, and then discount the resulting figure by a compounding discount rate, typically 15%, for the next five years. In cases where the durability of the impact is likely to be heightened (e.g., where a 30-year offtake agreement is in place, or where the investment has stood up a new company producing durable goods), we will adjust that discount rate down during the post-exit period.
For capex heavy deals, we may use either output in the last year of hold or an average across the hold period as the starting figure. We select which method to apply based on projected capital expenditure. If the company is not anticipated to make any new capital expenditures during the 5-year post-exit period, then we reflect a hold period value with low capex. For a deal with no capex in the last year of hold, this means continuing to use the output for the last year of hold. However, for a deal with significant capex in that year but none in the prior years, we would apply a hold period average. In contrast, if significant capex is expected during the post-exit period, then we would want to base the estimate on a hold period year with capex. We therefore base the calculation either on a hold period average or on the last year of hold, depending on which approach more closely reflects the projected growth and expenditure of the business post-exit projected in the deal team financial case. We note which method is applied in the impact assessment materials along with supporting evidence.
The third and final approach is applied for early-stage companies which have very low production projections during the Rise Climate holding period but scale up rapidly in the years after Rise exits the investment. For these companies, the investment often funds the research and development which is a critical catalyst for growth in the out-years. That future growth should therefore be captured in the impact analysis. Otherwise, our impact assessment methodology could risk incentivizing only investments in mature-stage technologies – and with so many climate technologies in the nascent development phase, such a barrier to investment would not serve the overall decarbonization mission of TPG Rise Climate. Having analyzed a number of early-stage deals, we determined as a general guideline that early-stage companies typically project that less than 10% of their output for the next ten years will occur in the first half of this period. Therefore, we apply the catalytic capital impact attribution methodology when a company projects that less than 10% of its total production over the next ten years will occur during the Rise Climate investment period (normally the next five years). When a company meets this guideline, we calculate the capitalized value of impact by taking the annual expected company impact in each of the post-hold years, and discounting by the same compounding discount rate each year. In other words, instead of taking the Year 5 impact and discounting that figure by 15% each year, we will project out the likely Year 6, 7, 8, 9, and 10 total impact and discount each of those figures by 15%, compounding in each year up to Year 10.
Accounting for potential future impact dilution
Whenever possible, we incorporate future projections of Rise Climate equity ownership or investments in future rounds of fundraising into our ex-ante impact assessment. These future projections may be integrated in the actual impact model (for example, if we know a coupon will increase the effective Rise stake along a certain annual schedule) or presented as an impact risk via a sensitivity table (for example, if there is a realistic likelihood that the company will re-raise capital in order to achieve their growth plan). Our approach therefore accounts for the future potential of increased company valuation diluting the effective impact that is attributable to Rise Climate.
Responsible for investing performance considerations
The impact assessment approach focuses primarily on the impact of, and material emissions to produce, a product and service in comparison to the counterfactual alternative. There are numerous other considerations that should be taken into consideration that are related to responsible investing performance. For these, we screen using a framework grounded primarily in the Sustainability Accounting Standards Board (SASB) materiality factors.
Conclusion
We aim to estimate impact utilizing research and with rigor so that investors can have greater confidence in the impact of the companies in which they invest. Our experience across the numerous companies we have assessed has taught us that context and the specifics of a company’s business substantially drive the magnitude of impact, and that evidence and research are key to understanding that impact.
We combine the core aspects of our impact monetization approach with the climate-specific nuances to deliver an impact decision tool that enables investors to understand and compare the emissions reduction potential of each target company.
As noted above, we continue to improve the approach as research and learnings dictate. We are happy to share this approach and learnings, and we welcome engagement with others on the methodology to continue to improve its usefulness as a decision tool.
Disclaimer: For informational purposes only; not intended as investment advice
1 Please see the section “Steps for quantifying the additionality of a climate company,” for additional details
2 To calculate GHG emissions averted, we project forward the future anticipated grid emissions factor—typically improving over time—and we include a degradation rate for the productivity of the asset as appropriate
3 Please see the section “Attributing in-year and lifetime impact,” for additional details
4 Please see the section “How we attribute the capitalized value of impact post-exit,” for additional details
5 When a deal has both carbon aversion and non-carbon aversion pathways, we monetize GHG emissions reductions via the social cost of carbon and then add it to the monetized adaption pathways to calculate the Impact Multiple of Money. For TPG Rise Climate investments, we apply the U.S. Interagency Working Group’s (IWG) dynamic social cost of carbon using a 2% discount rate (IWG, 2016). The IWG assessment includes growth in per-capita GDP (excluding climate impacts), alongside the discount rate, to estimate the present value of damages. We are using an updated version of the IWG assessment calculated by the State of New York which applies a 2% discount rate rather than the IWG’s 3% central discount rate (NY DEC, 2020). Government agencies have used a 3% rate since 2003 when the OMB estimated the three-decade average yield on 10-year Treasury securities as a proxy for the risk-neutral rate of return. Completing that same calculation today yields 2%, which is the reason New York has moved to 2% and why the IWG has indicated it will consider 2% for its 2022 update to the SCC (IWG, 2021; Greenstone). Please also note that since the Carbon Yield is not a monetized figure, we have not included a discount rate when estimating lifetime emissions. Lifetime emissions are an absolute figure that captures CO2e emitted rather than a monetized estimate of societal impact requiring adjustment to present value.
6 See the IFI’s GHG Accounting for Grid Connected Renewable Energy Projects (2019) for the methodology and sources used to derive the default grid emissions factors.